

Annual planning: part 2
Setting goals + crafting your plan to hit them

Last week, in annual planning part 1, we covered step 1 (review the previous year) and step 2 (review the upcoming year’s goals). If you haven’t had a chance to read that one yet, start there as today we’ll be building off of those two steps.
I’ll spare you any further preamble, but still want to note is that like last week, you’re going to hear me talking about attribution in this post. For those of you who’ve been following along, you know that I very much subscribe to an ecosystems, not channels or departments approach to customer acquisition. BUT, in order to do annual planning, there still is an element of attribution that needs to be used to be able to do apples-to-apples comparisons with historicals and for resource planning. I’ll explain more when we get to those sections, but noting this now before you all start coming after me with pitchforks 😅
Sponsor: You/Your Company?
If you’re looking to get in front of an engaged audience of some of the savviest marketers + GTM practitioners, this is one of the most under-valued places to do it. A few openings remain in this space starting next year. Don’t sleep on opportunities like these before more companies catch on + drive prices up.
Simply reply back if you/your company is interested or drop me a DM on LinkedIn.
Step 3: Setting goals
Now that we have a grasp on last year’s performance and know which overarching company goals are relevant to us, it’s time to get into the fun part - setting our goals. This is the step where we’ll be leveraging the data from step 1 (review the previous year) to help map out how we’ll get to our growth goals.
For many of you like me who are on the marketing side of the organization, this means determining our contribution to goals like net new acquisition revenue ($) and month-over-month or quarter-over-quarter growth rate (%). And for the purposes of this newsletter, we’re going to keep it simple by focusing on one goal - net new acquisition revenue ($).
Let’s use the below fictional scenario as our jumping-off point:
2024
Goal: $100M net new acquisition revenue
Actual: $90M net new acquisition revenue
2025
Goal: $125M net new acquisition revenue
2024 was a tough year for many B2B companies, so don’t be discouraged if your team came up short of the goal that was set the previous year. What we’ll want to understand if this miss was across the entire GTM team or if it was seen primarily in one part of the GTM team.
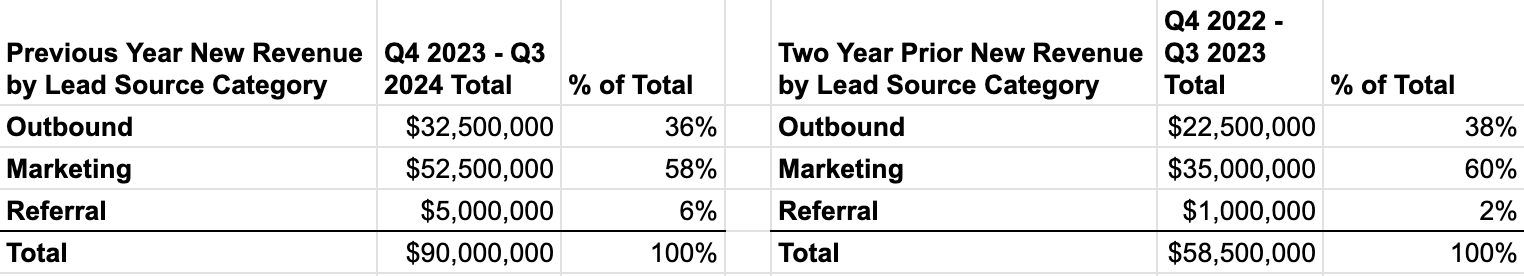
Going back to the simple table from step 1, I typically look at the previous two years’ worth of data to spot general trends around the contribution from key lead source categories. In the scenario above, Outbound is an array of lead sources that BDRs or AEs may use to source leads that they successfully prospect into, such as LinkedIn, lead aggregators, an ABM tool, etc.
The key thing I’m looking for here is understanding if we are seeing stable or fluctuating results between any sources. In this example, you can see it’s relatively stable year over year, which is helping for planning purposes moving forward.
From here, I do a quick “flat” model to get a pulse on what would need to come from the GTM teams if things remained consistent. So I plug in the 2025 target into the total, put the average % of total between the two years into column C, and then have a formula in column B to spit out what the target would be. For example, since we saw Outbound was 36% last year and 38% the year before, I put 37% into the model and then multiplied $125M * 37% to get to the $46.25M target.

But we all know as much as we’d love for everything to be consistent, scaling doesn’t quite work that way due to resources. For example, with outbound, how many AEs are on the team, how many BDRs are in the organization, is there a sales ops or rev ops function that helps them, etc. - you can see where I’m going with this. Same goes for marketing - how many team members are there, what has the ad spend been the previous two years, have there been any product/offer changes, etc.
And that’s what leads us to what I call the “planned” model that takes into account things like resourcing, trends, etc.
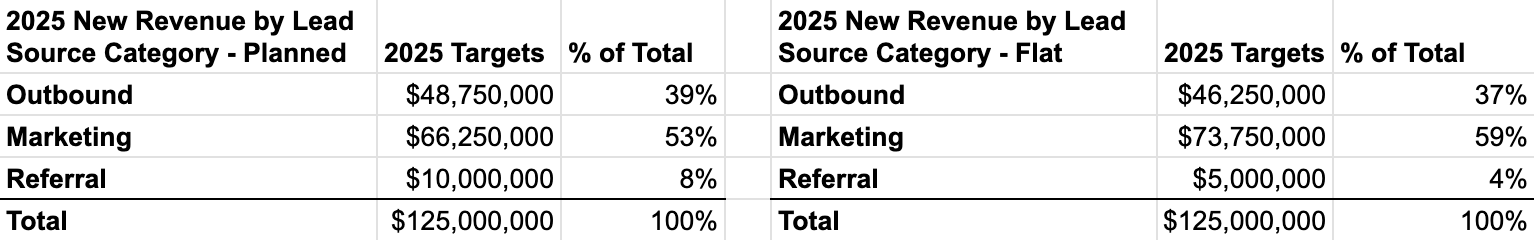
You can see the table on the left is the “Planned” model and the one on the right is the “Flat” model for comparison. This is the part where we go beyond simply using data + start applying context (remember: being data-informed > data-driven).
Let’s go line by line with some examples of how this typically plays out:
Outbound
For many organizations, when leadership announces growth goals, they recognize that they’re going to need more sales reps to close those deals (thanks, predictable revenue model). One thing this does help with in planning is understanding that more sales reps means an opportunity to do more proactive prospecting by those AEs and BDRs. More AEs and BDRs = more outbound revenue. So with this in mind, I typically look to see how many more outbound reps will be added, the type of role they’ll be (inside, outside, strategic, etc.), and get a pulse for if outbound should be able to contribute a higher percentage of revenue than before.
Marketing
For most B2B organizations, marketing accounts for the majority of revenue (%) in the early days. When it’s the founder doing most of the sales and maybe 1-2 others, they’re typically busy closing what’s coming in from marketing + word of mouth. As time goes on + the organization grows, more sales members are added, meaning the inbound is spread thinner between the growing sales team, so capacities are opened up for them to start prospecting.
As this happens, marketing’s contribution to revenue continues to grow, but the percentage at which it contributes will begin to decline year over year. This is normal. This is ok. This is expected. This is how businesses mature. The thing not to get caught up in is the percentage contribution so much as that the amount ($) is continuing to grow. So using our example, Marketing has grown from $35M two years ago to $52.5M last year to a goal of $66.25M for 2025. That’s nearly 2x from 2023 to 2025 - hardly something to balk at there.
This is where resourcing comes into play and understanding the current team headcount + bandwidth, how much variable ad spend is at play, and more when thinking about the upcoming year. And where it makes sense to apply more resources as a GTM team to accomplish our continued growth goals.
Referral
This is one that I want to make an example of as an unexpected growth lever to capitalize on. You can see that from two years ago to last year, the percentage increased “only” 4%, but that the net amount of it was an additional $4M. So being the data-informed marketer that you are, you dive in to understand what led to that increase.
To your surprise, you see that $4M of the $5M came in the last two quarters. Whoa, you think to yourself. If this normalized out over a year, that would’ve been $8M. So you dig in more and find that the program is finally taking off. Customers are sending referrals in left and right thanks to your formalized customer referral program. Influencer partners are excitedly sharing information about you to their followers. Everything is working beautifully.
So let’s ride that momentum. It would make zero sense to say referrals will only make up 4% of the revenue goal when we see that would be less than what it’s already done, so we add in our context and knowledge. We know it should easily pace to cover $8M, and with our increased growth goals and resources being added across the teams, we can make a bet that we can get an additional $2M from the program through further optimizations + expansions.
When you have levers like this taking off that account for a higher percentage of the revenue, that means that the percentages of other levers will decrease. Again, this is ok and is normal. The focus at the end of the day is on the $ goal for each, not the % goal.
Alright, time for a breather before the final step, that was quite a bit of information thrown at you.

Step 4: Craft your plan
You’ve aligned with the GTM team on where the revenue growth will tentatively come from (I say tentatively because remember, the GTM team is a team, and the focus at the end of the day is hitting the shared $125M goal together). Everyone’s excited about the coming year. Now it’s time to get out of the spreadsheet where it’s easy to map growth, and over to your notebook to begin outlining how this growth will be accomplished.
The first thing I like to do is map out all the levers we have at our disposal as marketers to drive new acquisition revenue. A short, non-exhaustive list to get your mind rolling:
Ad spend
Channels executing on (paid + organic)
Efficiencies (cost per demo, conversion rates through the funnel, etc.)
Pricing
Offers
Market expansions (geographical, up/downmarket, etc.)
Referral programs
Now that you’ve got all of these, this is where me writing a “how to do annual planning” gets quite difficult as there are an infinite number of paths you can/will go down based on the combination of your historicals, your growth goal, and which lever(s) you will pull to accomplish those.
For planning around the bullets for ad spend, efficiencies, and pricing, I tend to go back to my spreadsheet to see what we could realistically get those to. Unless you’ve got a cash printer in your office (lucky you), you likely won’t be able to get to 100% of your upcoming growth goals with just these levers.
That’s where the others come into play. What other channels are available to tap into where your market spends time or engages heavily? Reddit? Email newsletter? Founder-led marketing?
How do your offers compare to the competition? Are you more/less expensive? Are you rolling out new features that would allow you to capture a previously untapped segment?
Thinking about expanding into Europe? Asia? South America?
Looking to tap into the strong word of mouth your customers are already driving by further incentivizing them to send more your way? Finally going to partner with some thought leaders in the space to try and bring in some of their followers?
The sky is the limit for what you can do here. But to a great point made recently by Paul Stansik, “Focus on just a few ‘new things’: the specific behaviors that move the team from here to there. This is the side of leadership no one ever teaches you.”
Although you can go any number of directions, that’s where you have to remember resourcing and what happens if you do try to do too much (spread yourselves too thin) vs. trying to do too little (won’t hit your goal).
(Bonus) Step 5: Risk management
You’ve got your plan. You’re excited. The team’s excited. You present it to leadership and they’re fully bought in. So you breathe a sigh of relief.
Fast forward to early March, and there are rumblings about some flu strain that’s running rampant. Another few months go by and the world is paralyzed. Your pipeline is tanking, your team is scrambling, and you’re wondering what is going on.
^^ sound like a handful of years ago? Thought so. This is an (extreme) example of what can happen to any plan, no matter how great it is on paper, when unforeseen variables come into play.
And this is where having contingency plans are key. They don’t have to be anywhere near as built out as the main plan you have, but you should have something planned should a handful of different scenarios play out, such as:
What happens if your win rates start to tank with the current plans?
What will you do if a critical team member leaves?
How will you respond if a new technological advancement takes the world by storm (Hi, AI and LLMs)?
Again, these are just a few examples of any countless variables that could come up, but by having a rough plan for how you’ll handle some of the more likely to occur ones isn’t a bad idea to draft up while going through your annual planning.
And that, my friends, is my two cents on annual planning. Is it perfect? Absolutely not. Is it how everyone should go about theirs? Nope. But hopefully by sharing some of my process, that it’s given you ideas that you can work in as part of yours.
Tip of the week - Gmail keyboard shortcuts
I had been playing around with a new email tool called Superhuman recently + while catching up with my CTO the other day, was telling him about it and one of the things I liked the most - that they leveraged keyboard shortcuts into the app to make the email experience faster + easier.
Then he said to me, “You know you can do that in our work Gmail instance already, right?”
I’d been torn about whether to pay for Superhuman, but once he told me this, I knew my decision was already made that I didn’t need to. So, for anyone who wants to get a little bit more from their Gmail instance, I present to you just some of the keyboard shortcuts available to any Gmail users. To access this screen, simply type in a question mark while in your inbox (Shift + /), and you’ll be able to toggle the shortcuts on/off.
A few of my go-to’s:
v : move email to a folder/label
e : archive email
r : reply
f : forward
Command + return : send reply
Shift + u : mark unread
s : star
g then i : go to inbox

See you next Saturday,
Sam