

The One Mistake Most Marketers Make When Measuring Ad Campaign Performance
Are you accounting for the medium appropriately?

You have two campaigns running. You launched them at the same time and they’re targeting the same audience.
Here are the results you’ve seen so far:
Campaign 1:
→ 0.67% clickthrough rate (CTR)
→ $1.88 cost-per-click (CPC)
Campaign 2:
→ 3.50% clickthrough rate (CTR)
→ $0.33 cost-per-click (CPC)
QUICK - you just found out your budget was cut in half and you need to end one of these campaigns today. Which of these campaigns performed better and will be staying on?
You answered campaign 2, right?
Wrong.

What? How is that possible? This is where I have seen many marketers go wrong, including me 🙋♂️ for YEARS and this is exactly how I learned this lesson.
So how is that possible? I will let you in on one little secret that smacked me flat in the face one day. These platform metrics do not take into account the MEDIUM that the content is being delivered in.
Campaign 1 was a video ad that played in-feed for the target audience. All they had to do was scroll through the feed as they normally would, and if they wanted to see the ad all they had to do was stop scrolling so they could watch it.
Campaign 2 was a static single-image ad shown in-feed for the target audience. All they had to do was read the text on the ad to get a sense of what it was about and then click on it to get to the content.
Here is the big kicker. The thing that needs to be taken into account here is that the goal is for the content to be CONSUMED.
Remember - consumption is very different based on the MEDIUM it is presented in
For a video ad, you consume the content by watching the video in-feed.
For a static single-image ad, you consume the content by clicking on the ad to view the content that lives on a landing page.
Here are the keywords to hone in on: “watching” and “clicking”
Are you now starting to see the problem with the initial way we were measuring the campaign results?
The metrics we were looking at were CLICKthrough rate (CTR) and cost-per-CLICK (CPC). In order to see higher success with these metrics, they revolved around the user clicking as the sole means of consuming the content.
But wait, what about that campaign that we said was consumed by watching, not clicking?
Now you’re getting it - THAT is the right question to be asking.

In order to correctly compare these two types of campaigns, you need to have a metric that allows you to analyze the desired behavior. So what’s this all-encompassing metric? Cost per percentage of content consumed.
Sounds complex and difficult to calculate, but it's actually very easy.
🎥 Calculating for video ad consumption
Ad platforms have video metrics natively that allow you to see how many users watch certain percentages of videos. These are often in increments like 25%, 50%, 100%, etc., or are certain lengths of time the video was watched like 3 seconds, 10 seconds, etc.
In order to calculate this metric, what you do is you take the total spend of the campaign using the video medium and divide that by your desired increment listed above to get to the video cost per X% of content consumed.
Pro tip: I would recommend having multiple of these made. I typically set up cost per 25% of content consumed, cost per 50% of content consumed, and cost per 100% of content consumed.
📷 Calculating for single-image ad consumption
This is where you'll need to go beyond the ad platform and add custom scripts to your website so you can track scroll depth.
(For instructions on how to do this, here is a link to a Google Help article to do this with Google Analytics by using Google Tag Manager)
I typically add a few in so you can see 25%, 50%, and 95% scroll depth (I don’t do 100% because nearly no one reads through the bottom of the footer and that’s not really a part of the content being served).
Then take the total spend on the campaign using the single-image medium and divide that by your desired increment listed above to get to the landing page cost per X% of content consumed.
Pro tip: I would recommend having multiple of these made as well. I try to match the same percentages used from video so I can have an apples-to-apples comparison of the two.
Alright, enough data and metrics talk, let’s get into some practical insights now
Remember those campaigns we looked at in the beginning of this article? Here are the results after taking these new metrics into account
Campaign 1 (Video campaign):
→ 0.67% CTR, $1.88 CPC
→ $0.31 cost per 50% video consumed
→ $0.82 cost per 95% video consumed
Campaign 2 (Single-image ad campaign):
→ 3.50% CTR, $0.33 CPC
→ $1.46 cost per 50% landing page scrolled (consumed)
→ $3.79 cost per 95% landing page scrolled (consumed)
What just happened?
We removed bias from things like clickbait headlines, spam clicks, and more where you got the initial click, BUT the user never went past that to consume the content nested behind it.
We have a true apples-to-apples comparison looking at what we care about - was the content we want the audience to consume actually consumed?

With this new metric, we were able to see that it was significantly more efficient and effective for the content to be consumed via video delivered to the users in-feed.
Let’s think about why this works this way:
→ Social media platforms don’t want users to leave the platform. The longer they stay on the platform, the more ads they can serve which makes them more money.
→ It’s less intrusive to the user to stop their scroll and watch something while in the feed than to click on something, and then go and read through it in another place
→ You can communicate (and comprehend) more and faster via video than you can written word
All of this to say, once you understand how users consume your content and how you can measure it appropriately, you will open your eyes to an entirely different dataset and way to analyze what content AND medium actually lands best with your market.
Remember: the goal is for the content to be CONSUMED by the end user.
In this example, video was better than single-image. But that isn’t always the case. That’s why it’s important to be able to compare the two in an apples-to-apples manner.
If you’re interested in testing this for yourself, I would recommend doing it so everything is as identical as possible, with the only difference being the medium.
Customer stories are very easy to do this with, so I would start here.
Pull a customer story you have that you know has landed well overall with your market before.
For the single-image ad campaign, you have the landing page already (the written customer story). What you will want to do is create a single-image ad that speaks to something like the results they saw, a quote from the story, etc.
For the video ad campaign, you will want to create a video ad using the content from the written version. You can either do this via “talking head” where you or the featured customer talks about the same things that were covered in the written version. This could include things like the problem they had, the solution they found, the results they saw, etc.
Now you set up two campaigns in the ad platform, apply the same variables (give them the same daily budget, target the same audience, set the placements as the same so they only show in-feed, etc.), and let the campaigns run until you have enough data to find statistical significance between the two.
Congrats, you have successfully graduated from 101-level campaign measurement into 301. You may need to pick your CMO’s jaw up off the floor after you run through this analysis with them.
One LinkedIn post I bookmarked this week
Jeff Gapinski said he’s officially cracked the landing page "formula” after building 400+ sites.
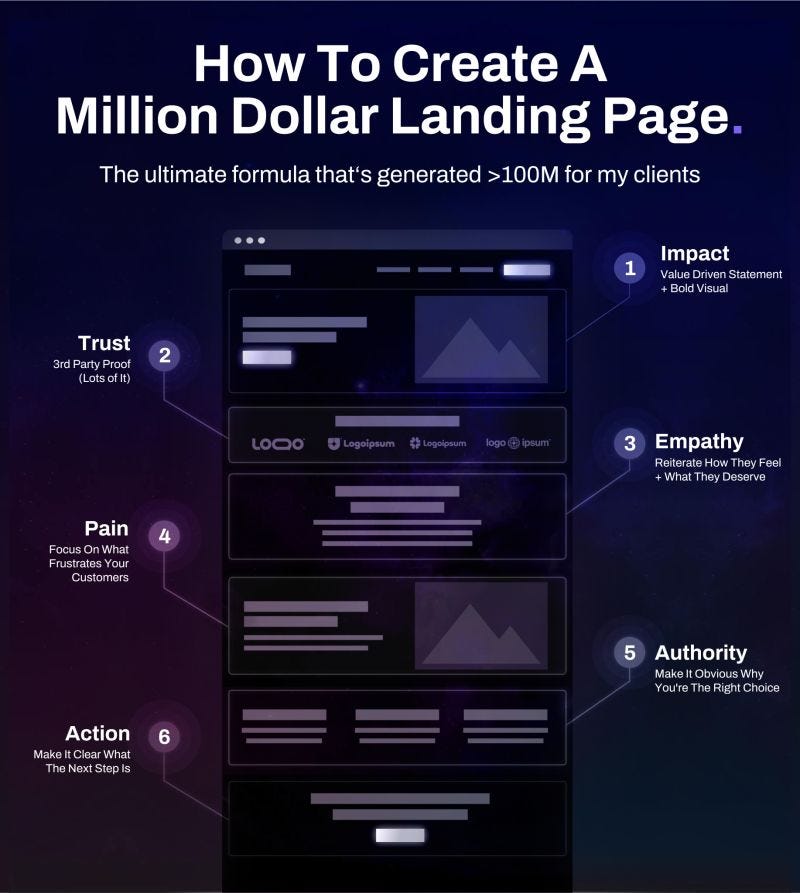
A few points Jeff made that had me taking notes:
“3. Empathy
Customers want to feel seen. Make it clear you understand where they are and what they deserve.
Empathy Headline Formula:
[Question] + [Deep Rooted Concern]
Empathy Headline Example:
Do you have an amazing product but struggle to communicate it's true value?”
Too many of us (myself included) skip this part because we assume the prospect is here because they know they have a problem. The beauty of this recommendation is the connection it helps create between the prospect + your company/product/service.
“5. Authority
Make it obvious why you're the right choice. Clearly communicate how you've solved these problems for people just like them.
Authority Formula:
We Help [Customer Industry] + [Path Forward]
Authority Example:
We help B2B SaaS companies write copy that clearly communicates their value and prompts action.”
This is one that really hit me once I joined Loxo. The number one thing prospects care about when evaluating potential products or services is “Is this built specifically for companies like mine?” This could be an industry, company size, maturity stage, a specific niche within a field, etc. The better and more clearly you can answer this, the more likely you are to have them seriously considering you.
One podcast episode I enjoyed this week
Don’t be thrown off by the release date of this episode. Even though this was published 8.5 years ago, it’s just as insightful today as it was then. (Side note: this is the power of creating GREAT content. The lifespan on it can be YEARS, not just the duration of a 4-8 week “campaign”).
I’ve always been fascinated by Casey Neistat. His creativity. His story. His values. His experiences. His candidness. So whenever I start to get in a creative slump, I often find myself searching through any videos or podcasts he’s been on.
What I truly appreciated about this conversation was what he hit on with the final question he was asked about finding his natural drive:
He might be one of the happiest people that I’ve ever met. Here’s a guy who’s got a beautiful wife, he’s got two beautiful kids, he lives in a house, he’s got job security, he literally has more money saved up than I do…he lives a responsible lifestyle, he’s got his hobbies, he’s got his things he’s enthusiastic about, he runs.
He’s a really happy human being. And I look at him, and he is a guy who is one of the most successful people I know. And I think to look at someone who works at a restaurant and think “well he’s not successful”, I think that’s bullsh*t.
I think that success is defined not by how many cars you have or any of that sort of nonsense, but success is defined by how much of your day are you spending doing something you really hate doing?
And I look at him, and I don’t think he spends a whole lot of time doing things he hates doing.
And for anyone interested, here’s a playlist I add to every week with some of my favorite podcast episodes:
See you next Saturday,
Sam
Great article.
It reminds me of one LinkedIn post that you released a while ago, but you expanded it!
Now I can’t wait to run a fair split test between Image Ads and Video Ads.