

When goals aren't actually goals
A tale of marketing hitting 120% while sales missed by 25%

Marketing: "We hit 120% of our MQL goal!"
Sales: "We missed revenue by 25%..."
^^ Anyone else see the problem here?
This disconnect happens because most marketing plans are built and measured backwards.
We think we're being "data-driven" by breaking down THE goal (revenue) into sub-goals (MQLs, etc.), but forget that those are NOT goals - they're indicators to that goal.
So what should we do?
Sponsor: You/Your Company?
If you’re looking to get in front of an engaged audience of some of the savviest marketers + GTM practitioners, this is your opportunity. One opening per month to sponsor this newsletter has become available and I’m sure will claimed quick, so if the audience reading this newsletter is your ICP, this is your chance.
Just last week I was talking to a VP of Marketing and they said they were exploring and in negotiations with one of the sponsors of this newsletter after learning about them here + seeing them as a product that I endorse. That’s the power of these types of partnerships done well (vs. the AI influencer dumpster fire some are experimenting with).
Simply reply back to this email if you/your company is interested or drop me a DM on LinkedIn.
Same team, same goal…different outcome?
Early in my career, I remember sitting in on a quarterly business review.
First up, Marketing.
Leadership pulls up a few slides that are lit up in green, percentages are all above 100%, they’re very pleased with their results.
Next up, Sales.
Leadership pulls up a few slides that are mostly yellow + red with a few green datapoints, percentages are all around 70-80%, they’re disappointed to not be sharing better news.
How is this possible?
When I thought deeply about it, I had multiple conflicting thoughts:
How can two teams with the same goal (acquire new customers) have two very different outcomes?
If they have the same overarching goal, why are the success measurements for the two groups not that same goal?
Further, why is the goal of one (marketing) not actually a goal, but only a leading indicator that does not guarantee success of the goal being hit?
So as we drill into the root issue here with marketing goals + planning, I believe that while it starts with good intentions + good logic in theory, it breaks down once put into practice.
And this is where the divide we currently find ourselves in becomes apparent.
In one camp, the theorists continue forward with their “perfect on paper” plans, yet continue to scratch their heads + deliver excuses to leadership when the marketing activity/revenue disconnect continues on month after month, quarter after quarter.
In the other camp, the practitioners have watched as the perfectly linear marketing plans the theorists draft up - the “the business growth goal is 20% this year, so marketing’s lead goal will increase by 20% as well, and we can assume we’ll have the same cost pers (lead, opp, deal) + conversion rates (lead > opp, opp > won).” - continue to fall apart month after month, quarter after quarter.
And they recognize that this breakdown occurs because of 3 core reasons:
1) Wrong focus
These plans focus on increasing lead volume as the singular variable to achieving growth. Further, the plans almost always assume they scale linearly - that they’ll continue as efficiently as they have in perpetuity.
2) Marketing activity/revenue disconnect
As mentioned earlier, leads are a leading indicator to revenue, not a measure of revenue. There is no direct connection between these marketing activities and actual revenue. Or to put it in a context that illustrates just how disconnected these two items are, if you heard the statement “We drove 500 more leads this quarter,” that tells a leader nothing about actual business impact.
3) Marketing success ≠ business success
When marketing’s goal is different from the GTM team’s goal, or the larger business goal, we shouldn’t be surprised when we see different outcomes between the groups. Marketing is orienting toward hitting their “indicator target,” not the actual revenue goal.
So how does this happen? More curiously, how does this happen across so many companies with incredibly smart + talented individuals?
Cascading goals - right idea, wrong execution
At the beginning of every year, it’s common to see leadership set a revenue growth goal for the organization.
“We’re going to grow from $80M to $100M ARR this year.”
Great goal. It’s clear. It has specific numbers. It sets the tone for how hard the organization is going to have to push to achieve that goal.
But here’s where the execution starts to make things murky.
Across a GTM team, most companies have multiple departments that are responsible for the acquisition engine. Sales and Marketing for most every company, BDRs at those who’ve made it past early stage growth, Partners at those who are in mature growth. So leadership divvies up that $20M across the departments that contribute to this growth.
Again, great in theory, but in execution, this is where things start to breakdown. (And I’m not even going to get into the attribution issue here - if you’re reading this newsletter, you already know my feelings here).
Let’s take that $20M growth goal and we’ll keep it simple, assuming it’s just Marketing + Sales responsible for achieving this goal.
Marketing leadership is told they’re responsible for driving $12M of this (aka, $12M in marketing-sourced revenue).
Sales leadership is told they’re responsible for driving $8M of this (aka, $8M in sales-sourced revenue).
Then the department leaders further cascade these goals down so they can have each of their team members working towards achieving their department goal.
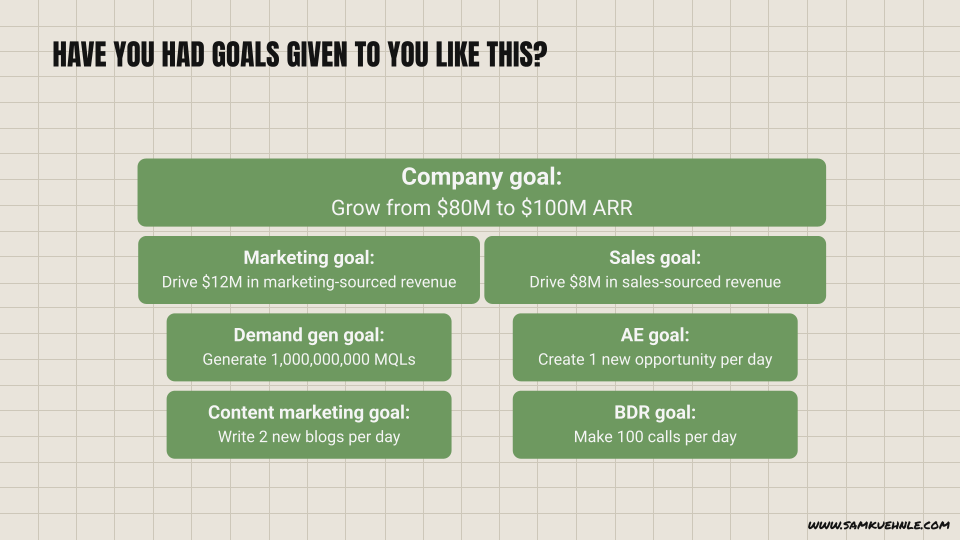
Demand gen marketers are told their goal is to generate 1,000,000,000 MQLs this year.
Content marketers are told their goal is to write 2 new blogs per day.
AEs are told their goal is to create 1 new opportunity per day.
BDRs are told their goal is to make 100 calls per day.
But here’s the thing. These are no longer goals being assigned. They’re metrics.
And as Goodhart’s Law tells us, “When a measure becomes a target, it ceases to be a good measure.”
So that cascading goal chart? This is what this looks like in reality:
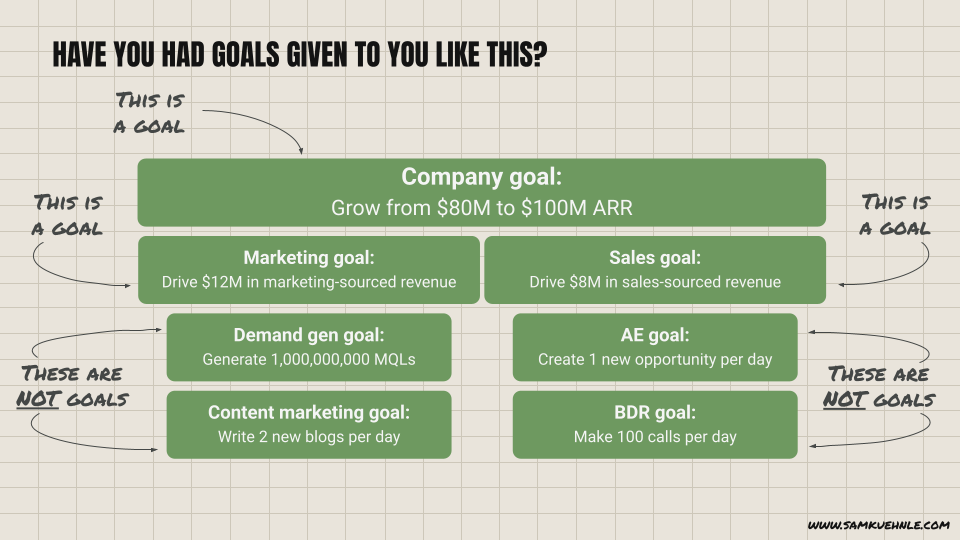
And this is exactly why in the same meeting, we have marketing cheering about hitting 120% of their “goal”, meanwhile sales disappointingly sharing that they only achieved 75% of their “goal.”
How most teams plan: channel by channel
Let me know if this sounds familiar.
GTM leadership has received their goals + starts cascading it out to their teams.
They’re going to go team by team, channel by channel, to come up with the final number of leads they’re going to drive this quarter.
Paid ads are going to drive 1000 leads this quarter
Content is going to drive 250 leads this quarter
Each BDR is going to drive 120 leads this quarter
Yay! We have 1370 leads we’ll drive this quarter.
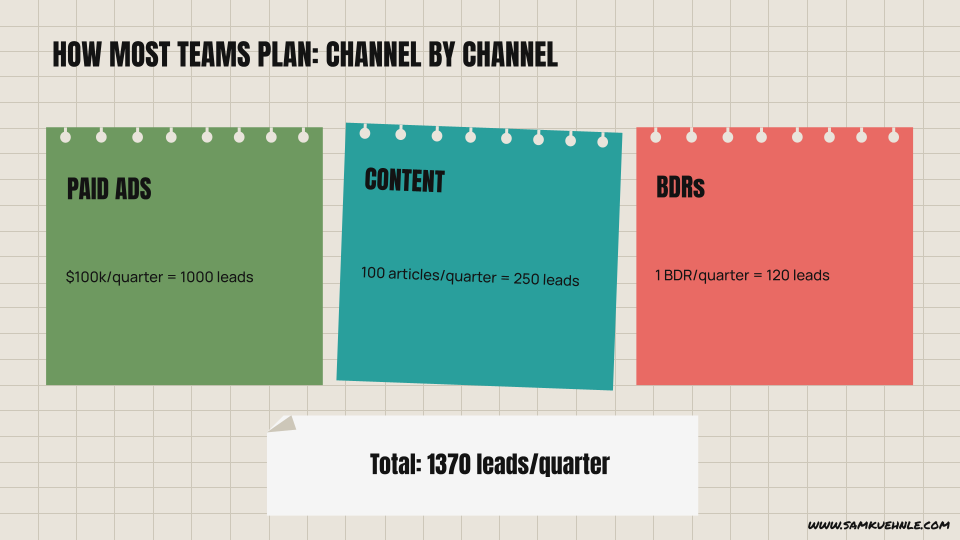
This is an additive mindset. This is how 95% of companies operate with their resource planning.
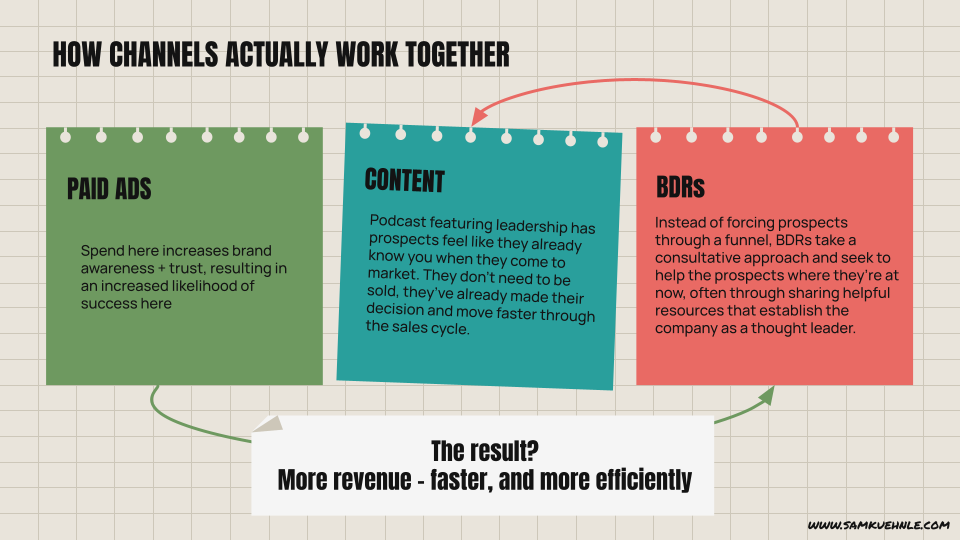
And this is another example of where the marketing theorists + practitioners diverge. Channels don’t actually operate like this in the real world. They aren’t blocks that can be nicely stacked on top of each other, each living in their own little world, operating independently.
The reality is that channels operate within a larger ecosystem. So instead of viewing them from an additive lens, we should view them more like this:
Start with revenue first
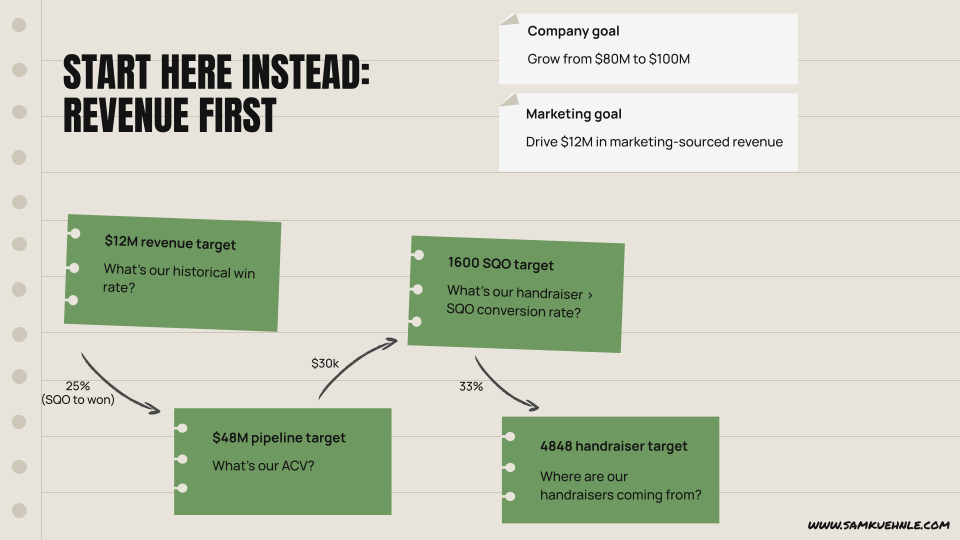
With this all in mind, let’s now let’s take that same overarching company goal of growing from $80M to $100M ARR in a year + I’m going to map out how I ensure our team is constantly tracking to the shared company goal, not a marketing “indicator” goal.
First, I take the revenue target we’ve been given, so $12M in this instance. Then we grab historical data, our handy-dandy spreadsheet, and start plugging some numbers in.
The next number I’m going to grab is our historical win rate. In this example, we’ll say it’s 25% from SQO to won. This means we will need to generate $48M in pipeline ($12M x 25%).
The next number I grab is our average annual contract value. In this example, we’ll say it’s $30k. This means we will need to generate 1600 SQOs ($48M / $30k).
Finally, the last number I grab is our handraiser > SQO conversion rate. In this example, we’ll say it’s 33%. This means we will need to generate 4848 handraisers.
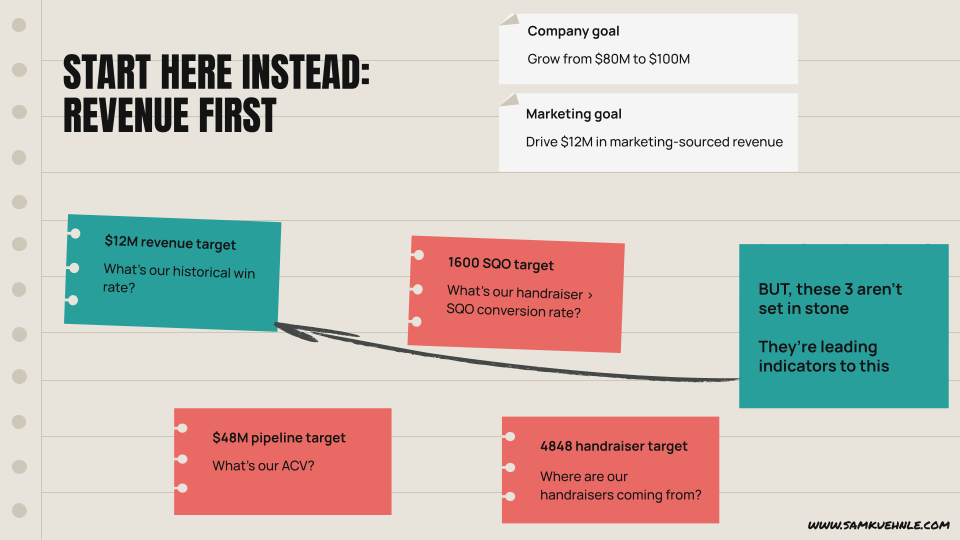
BUT, the pipeline, SQO, and handraiser targets are indicators - they aren’t set in stone. Remember: they’re indicators to the $12M revenue goal.
This is incredibly important to remember. As the year goes on, we marketers are scaling our programs. We’re spending more on ads. We’re sending more emails (or we’re sending better emails). We’re expanding into other channels.
AKA, with so many variables changing, it’s irresponsible to think that our funnel efficiencies will remain constant that entire time. Our cost pers are going to change. Our conversion rates between stages are going to change.
THIS IS OK.
This is where we adapt. In fact, each quarter I “reforecast” our indicators so I know what our funnel should look like in effort to achieve our quarterly revenue goal. I account for what has improved/worsened within the funnel as we’ve scaled. I account for seasonality. But the revenue number (goal) at the bottom remains the same.
As the old saying goes, “All roads lead to Rome…”
We’re continuously adapting to our ever-evolving GTM ecosystem. Every time we spend more money, enter new channels, add more BDRs/AEs, etc., we’re changing our multi-variable GTM formula where each variable operates as a force multiplier to the others. It is not an additive formula.
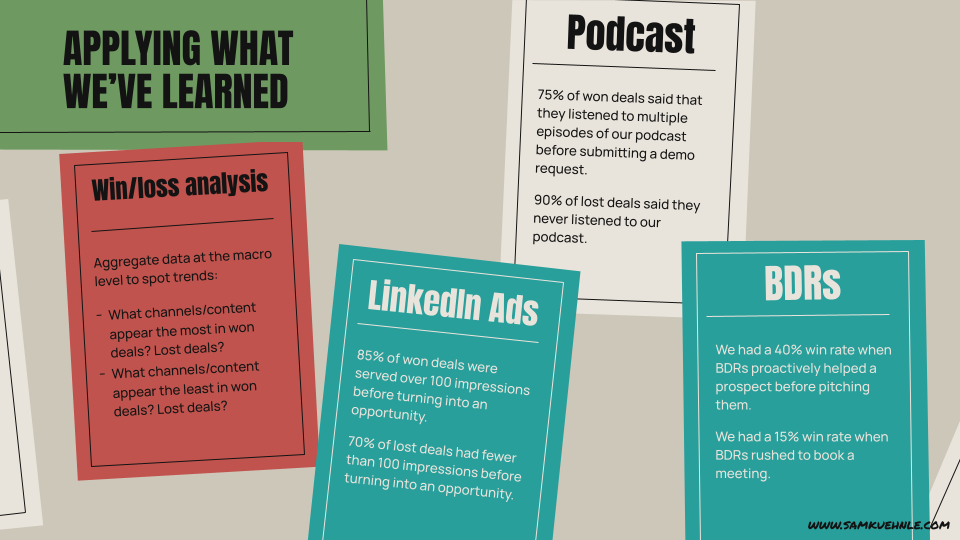
If we run a win/loss analysis on a given period and look at how each channel was contributing towards the larger goal, you’d probably see some unique insights such as:
—> 85% of won deals were served over 100 ad impressions on LinkedIn before turning into an opportunity. 70% of lost deals had fewer than 100 impressions before turning into an opportunity
Interpretation: Credibility, trust, and authority was demonstrated early on much more in won deals than lost. This meant that when the prospect talked to sales, they likely had a better understanding of how we can help + what they would accomplish with us vs. needing to be “persuaded”.
—> 75% of won deals said that they listened to multiple episodes of our podcast before submitting a demo request. 90% of lost deals said they never listened to our podcast.
Interpretation: Our podcast is a great way to communicate our unique POV AND generate a bond with our market. They share similar views/values and our podcast was able to develop these “relationships” so that by the time they came into the sales process, the pitch deck simply reinforced what they already know + believe vs. trying to convince them of our POV.
Fast forward: next quarter’s business review
Let’s paint a picture of how next quarter’s QBR could look with this type of alignment.
Marketing presents first.
Instead of showing MQL numbers, they pull up a slide showing pipeline and revenue contributions. "We're tracking at 103% to our $3M quarterly revenue contribution target. Here's what's driving it and what we're watching closely."
Sales presents next.
Different slide, same numbers. "We're at 103% to our quarterly revenue target. Marketing's ecosystem approach is working - prospects are coming in more educated and we’re converting them 25% faster than last quarter."
Same meeting. Same data. Same outcome for both teams.
This doesn’t have to be a fantasy scenario. This is what happens when we stop treating indicators like goals and start building everything around the number that actually matters.
Two years from now, you'll look back at this moment as either the time you kept playing the MQL game while your competitors figured out revenue-first planning, or the time you made the shift that changed everything.
Which story do you want to tell?
Book quote of the week
“If something is all you have ever known, you mistakenly believe that’s just how it is. Perhaps this is the greatest danger, that we don’t even recognize another way.”
- The Lion Tracker’s Guide to Life, by Boyd Varty
See you next Saturday,
Sam
P.S. if you liked today’s newsletter or have enjoyed some of the earlier ones, forward this along to a marketer you think would like it as well 🙂 This newsletter grows by word of mouth + I can see which weeks resonate more/less with you all based on how many people do (or don’t 😅) subscribe after reading.
Feeling this. We've all been there. Especially with under-experienced leadership. But very much enjoy seeing your philosophy and process as always.
Happy 2026 budgeting season.