

I've audited 100+ funnels. Here's what I found.
+ how to diagnose yours

I've audited 100+ B2B funnels over the years + most companies struggle with 1 of 4 funnel issues at any given time.
And if you’re at the same place for long enough, you’ll probably come across the other 3 as the company grows.
If you’re reading this newsletter, you’re a savvy GTM practitioner. You know how + where to gather relevant data from to inform your plans. For today’s newsletter, we’re going to get tactical - breaking down your current funnel, diagnosing what’s going on inside of it at critical points (whether good or bad), AND then going over what we can do to set ourselves up for success moving forward.
Let’s get to it 🤓
Sponsor: HockeyStack
Most ABM programs fail before they even start. I've been guilty of this myself + is why I'm approaching it differently this year.
In the past, we'd celebrate impressions served to target accounts like it was a business outcome, but we all know it's a leading indicator at best. What actually matters is connecting ABM activity to the things that keep the business going - pipeline, revenue, and expansion.
This dashboard from ABM king Andrei Zinkevich + HockeyStack is the closest thing I've seen to what that looks like in practice.
The beauty of this dashboard is that it's truly all-encompassing. It's not just net new revenue or "impressions served to target accounts." Just a few of the items you can see with this:
→ Net new revenue from ABM campaigns
→ Expansion revenue from ABM campaigns
→ Renewal revenue from ABM campaigns
→ Funnel metrics from current deals in pipeline
→ ABM penetration by stage
→ High-intent leads without deals
→ Account engagement by company
→ Website "high intent" account journeys
First things first - the funnel itself
MQL. PQL. SQO. SQL. Stage 3. Handraiser. Download.
The list can go on literally forever. We’ve come up with more acronyms than we know what to do with. And every company usually has their own unique combination of them which makes comparing performance always subject to the “well, we’re unique!” line (note: our setups really aren’t as unique as we think).
For this exercise, like most things, simplicity wins. So for today’s newsletter, we’re going to keep with that simplicity as it relates to the funnel. The heavy majority of B2B companies operate off of a sales-led motion (SLG), even if they have a product-led (PLG) motion that complements it. For today’s newsletter, we’re going to focus on the sales-led side.
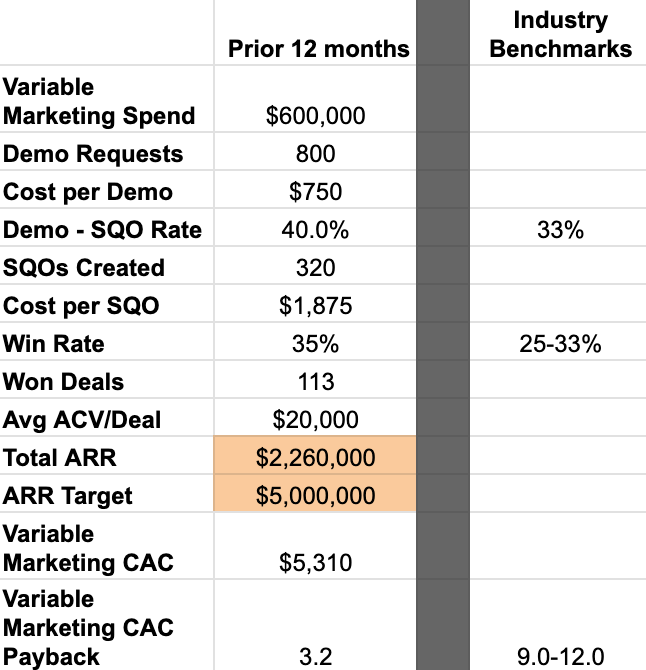
Here’s the basic funnel that we’re going to use:
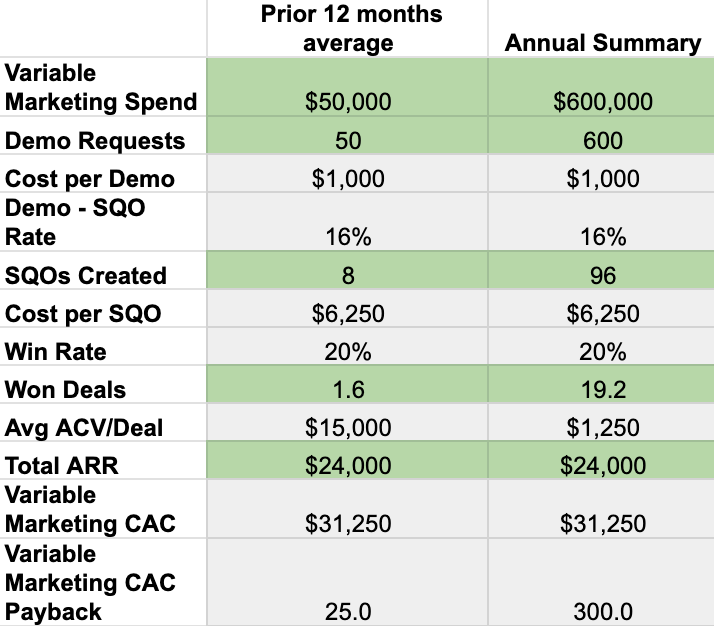
The cells in green are your inputs:
Variable spend (think: ads, events, etc.)
Demo requests (if your company is predominantly PLG, simply update this to be signups)
Opportunities created (I would recommend this being the stage at which your company considers them qualified)
Opportunities won (this one’s straightforward)
Total ARR/annual recurring revenue (how much revenue was booked per 12 month basis)
Now it’s your turn to start playing. Here’s a link to a sheet you can use for this exercise - simply make a copy + you can start dropping your own numbers in.
Once you fill in the green cells in the tab titled “Baseline,” you’ll now have your…wait for it…baseline!
And now that you have that baseline documented, let’s quickly talk about the key growth levers:
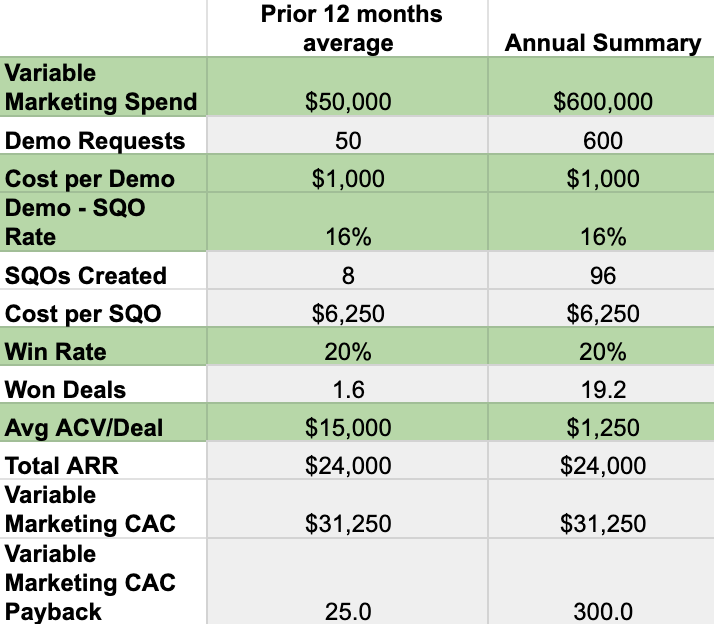
Now we have some new cells highlighted in green here. These are your key growth levers that you can control.
Variable marketing spend
Add more spend to what you’re currently doing. More $$ behind ads, more microevents hosted, etc.
Cost per demo
Tighter targeting + focus on better fit prospects (ICP)
Demo - SQO (sales qualified opportunity) rate
Get rid of any obstacles that would prevent a prospect from becoming qualified
Win rate
Look at where the majority of revenue comes in (industries, company sizes, regions, etc.) and focus there
Bonus: if you’ve done a win/loss analysis, look at the most common reasons for loss + implement solution(s) toward fixing those
ACV (annual contract value)
Right fit prospects don’t need discounts - they understand the value you provide
Similar to win rate, when you know where your revenue comes from, you will see differences between firmographic datapoints that may have you exploring how to get more from those specific companies
Now we’re ready to identify which of the 4 funnel issues you may be experiencing.
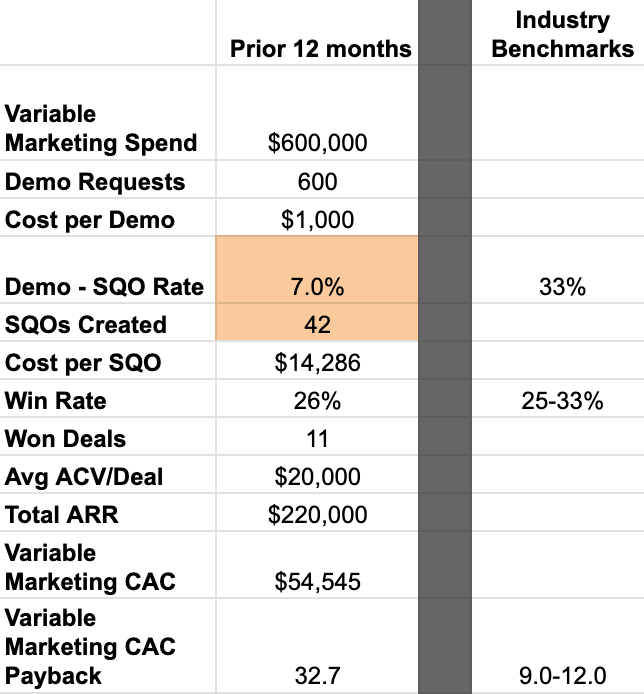
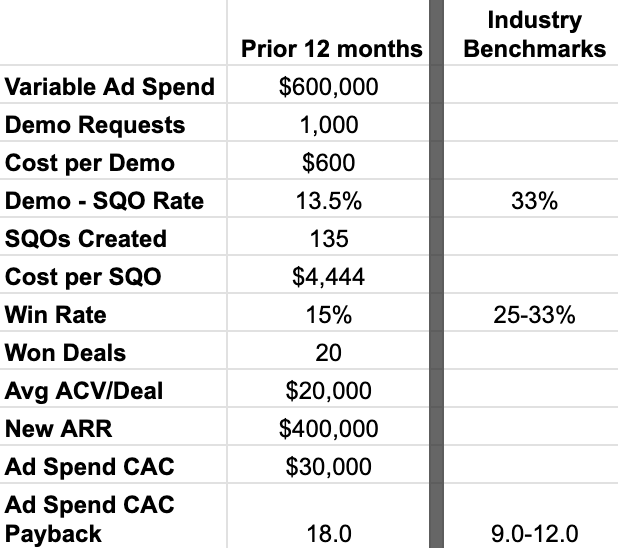
Funnel issue #1: lead gen 101
If I had a dollar for every time I saw this one back in my Refine Labs days…
This is what the funnel looks like when using the traditional “lead gen” playbook. Everything is gated. Webinars + ebooks + badge scans are the primary lead sources from marketing. Marketing is always celebrating that they’ve hit their monthly/quarterly “lead” goal, but sales somehow misses their pipeline and revenue goals despite “all of the lead volume” marketing is sending them.
To be blunt, it’s because the leads are 💩. They aren’t actually leads, it’s a false top of funnel measure.
How to spot this:
“Leads” coming through aren’t true demo requests/handraisers - these prospects aren’t ready to start the purchase process
The lack of quality/premature nature of these show up when you look at the conversion rate between “Leads” and SQOs
Often shows itself when you see a “too good to be true” cost per “lead”, but high cost per SQO (function of a low lead → SQO conversion rate)
Even those that make it to the traditional SQO stage often close at a lower rate than they should because they’re being pushed through the funnel vs. being more naturally pulled through it
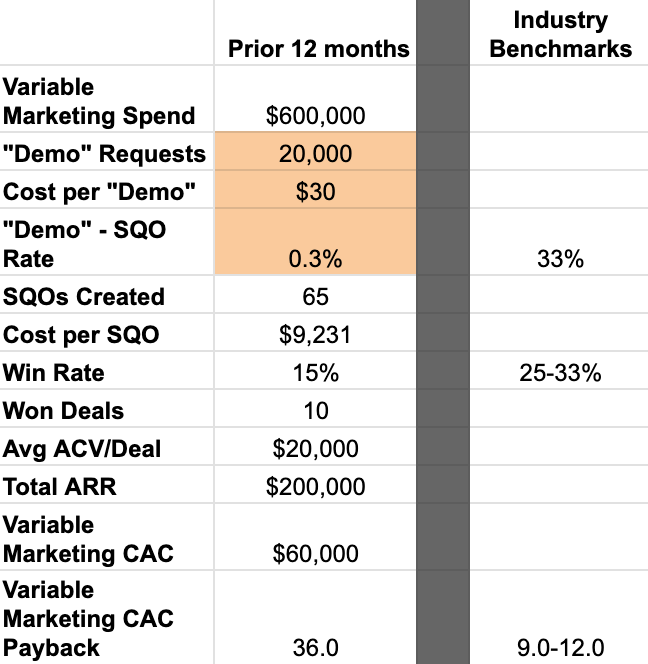
So in the example above, we see this in the orange cells as a hyper-inflated number of “demo” requests, a “too good to be true” cost per demo of $30, and an abysmal demo → SQO rate of 0.3%.
What you’ll also see in the images in here are a column that has rough industry benchmarks for what good looks like. These will be helpful for you to spot how close/far off you may be (and what’s realistic).
How to fix this:
Split the funnel by lead sources (demo requests, webinar leads, etc.) to understand if specific programs/campaigns can be optimized/removed
End programs/campaigns that are budget drains while continuing/iterating
off those that can be salvaged (specific keywords in search, social
campaigns with high engagement - understand why, etc.)
Ungate “lead” assets + let them be consumed for free
Stop passing these types of false “leads” over to Sales as “qualified”
Note: High-intent handraisers like demo requests won’t be impacted as they don’t come in through these campaigns
Reallocate spend from these lead gen campaigns to efforts that generate more
efficient handraisers + SQOs
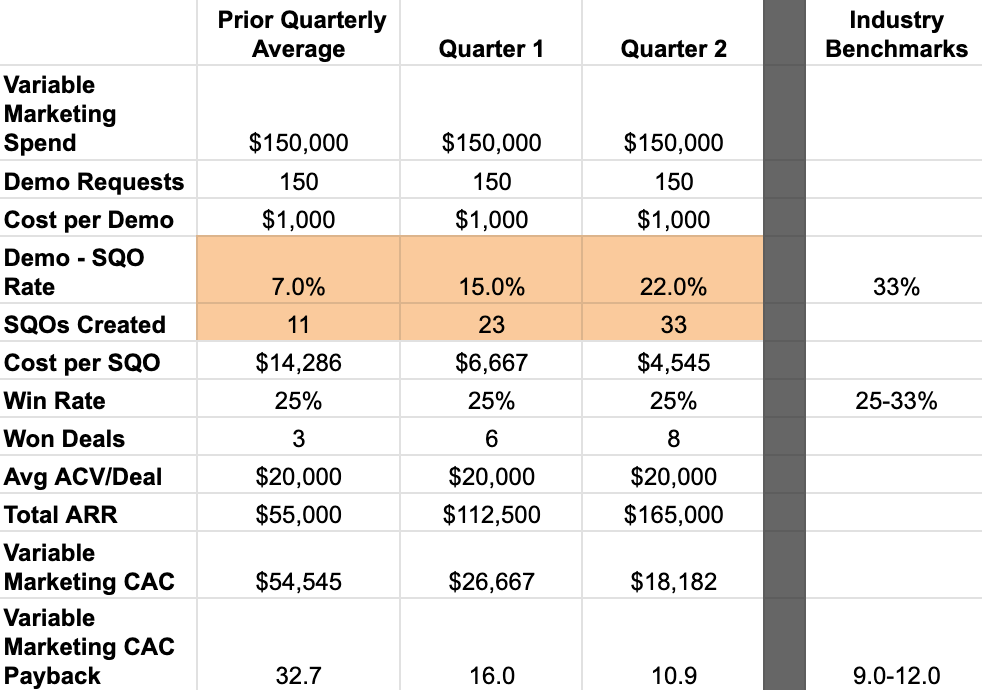
What this looks like as it’s played out over a few quarters:
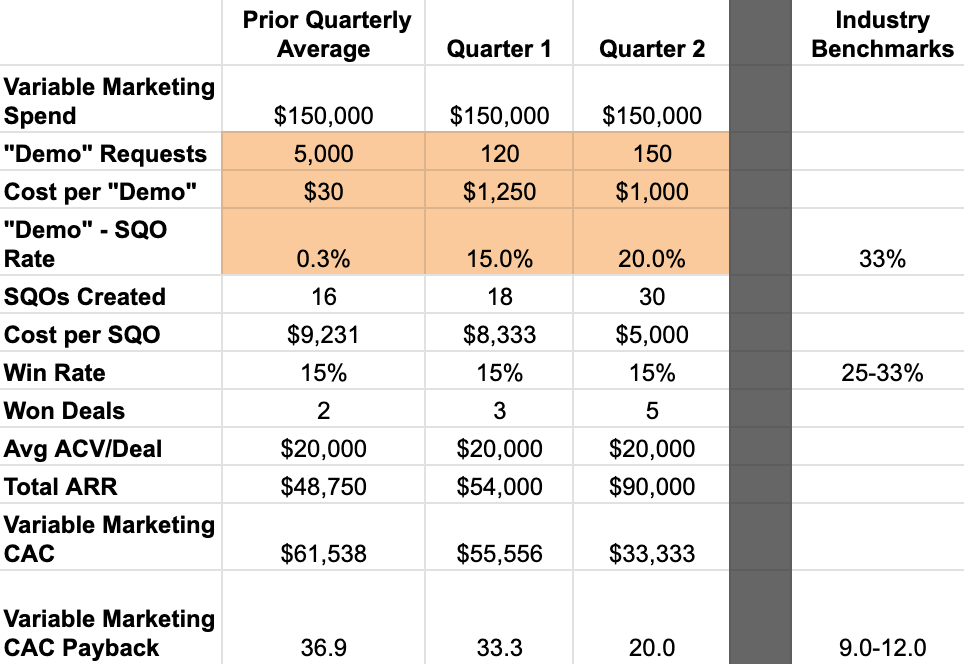
Your “demo” requests line is going to decrease drastically. Don’t freak out, this should decrease because what was being counted here before weren’t actually demo requests.
Pro tip: make sure you communicate this to your leadership team ahead of time though or you’re going to wake up to a lot of “WTF HAPPENED!?” emails when they get the first report
Your cost per demo is going to increase drastically for the same reason as above. This is expected + ok.
Most importantly, you’ll see your demo → SQO conversion rate shoot through the roof compared to before (+ your sales team will start to love you again)
Funnel issue #2: marketing/sales misalignment
You’ve cleaned up the 💩 leads from coming through and have a more accurate representation of who’s coming inbound that are true-fit prospects. But for some reason, even though you know these leads are better, they aren’t converting like you know they should be.
Enter: marketing/sales misalignment
How to spot this:
Demos/handraisers are measured correctly + are strong-fit ICP
Similar to Lead Gen 101, dropoff occurs at the demo → SQO conversion rate
Since we know we aren’t running “lead” campaigns + are reporting on true
high-intent handraisers, lead gen 101 can be ruled out
Marketing/Sales misalignment is often the cause of the dropoff here
Sales reps are historically used to marketing sending poor leads, so they
don’t follow up on these as they expect them to be similar
There’s a constant game of phone/email tag to try and coordinate the discovery call
Discovery call frustrations from answering repeat questions they’ve already answered on forms, from talking to BDRs, etc.
Even with a great sales team (win rate), this isn’t efficient due to few SQOs
available to be won
So in the example above, we see this in the orange cells as a very low demo → SQO conversion rate and a resulting very low number of SQOs.
How to fix this:
Determine why + where the dropoff is occurring
Sales not following up?
Backend processes not sending data correctly?
Phone/email tag between SDR/prospect to schedule?
Prospects frustrated they can’t get simple information? (Pricing, demo, etc.)
Implement the correct fix(es) as needed
Align with sales leadership on demo request follow up process
Dig into marketing automation to determine where data isn’t passing
Look at a solution like Chili Piper or Calendly to allow prospects to schedule meeting when it works for them + avoid the back and forth of trying to coordinate that call via email
Set expectations clearly on demo form, have pricing publicly available
What this looks like as it’s played out over a few quarters:
Your demo → SQO conversion rate will pick up quickly
The 1-2 punch of telling the sales team “hey, we’re sending you people who actually want to talk to you now” + letting prospects schedule a day/time for the demo as soon as they fill out the form cleans up the 2 biggest reasons for dropoff between these 2 stages
Your number of SQOs will increase significantly simply as a function of the increased conversion rate
Of the 4 funnels, this one is the most common AND most easily fixable. Just requires open communication between GTM leadership, aligning around the right strategy, and adding 1 tool to the mix (calendar scheduling). Then you sit back + watch the pipeline pour in.
Funnel issue #3: poor product/market fit
This one shows up more often in earlier stage companies or in companies that have rolled out new products, expanded into new markets, changed their plans, etc.
How to spot this:
Demos/handraisers are measured correctly + are strong-fit ICP
Strong demo → SQO conversion rate
Dropoff occurs at win rate - analysis on loss reasons shows majority come from
loss due to things such as: “Price”, “Functionality”, and/or “Competitor”
Common causes for this:
Company wants to go “upmarket”, but product isn’t able to support this yet.
Product built to meet SMB/MM functional needs (think: Hubspot), but priced
as if serving enterprise (think: Marketo) - you’re too expensive for those who
want it, but not comprehensive enough for those who can afford it
Missing critical features/functions that are needed in prospect’s role or that a competitor has
Your offer is a commodity in the market + the same service level/features
can be found at competitors for less
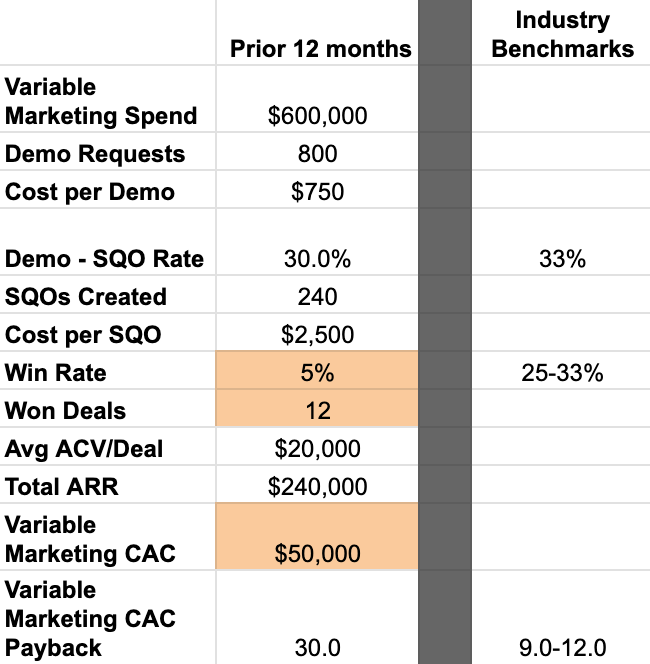
So in the example above, we see this in the orange cells as a very low SQO → win rate, a resulting very low number of won deals, and a very high customer acquisition cost (CAC).
How to fix this:
Perform win/loss analysis + look at the top reason for loss buckets
Discuss with product marketers, marketing leadership, + sales leadership as needed
Implement the correct fix(es)
Trying to go upmarket
“We’re targeting upmarket + pricing at that level, but the product isn’t able to support their needs yet, while SMB/mid-market are actively requesting to purchase, but are being turned away. We need to find a balance of supporting both and grow into upmarket”
Price
“When we see this many people reach mid-stage opportunity but a low win rate with pricing as the reason for loss, that tells us they see the value + want the product, but it’s not affordable for a company like them”
Functionality
“When we see this many people reach mid-stage opportunity but a low win rate with functionality as the reason for loss, that tells us we’re missing a key product feature that’s necessary for the prospect to do their job well”
Competitor
“When we see this many people reach mid-stage opportunity but a low win rate with competitor as the reason for loss, that tells us their product is either better, offers more features for the same price, or offers the same features/better service for a lower price”
What this looks like as it’s played out over a few quarters:
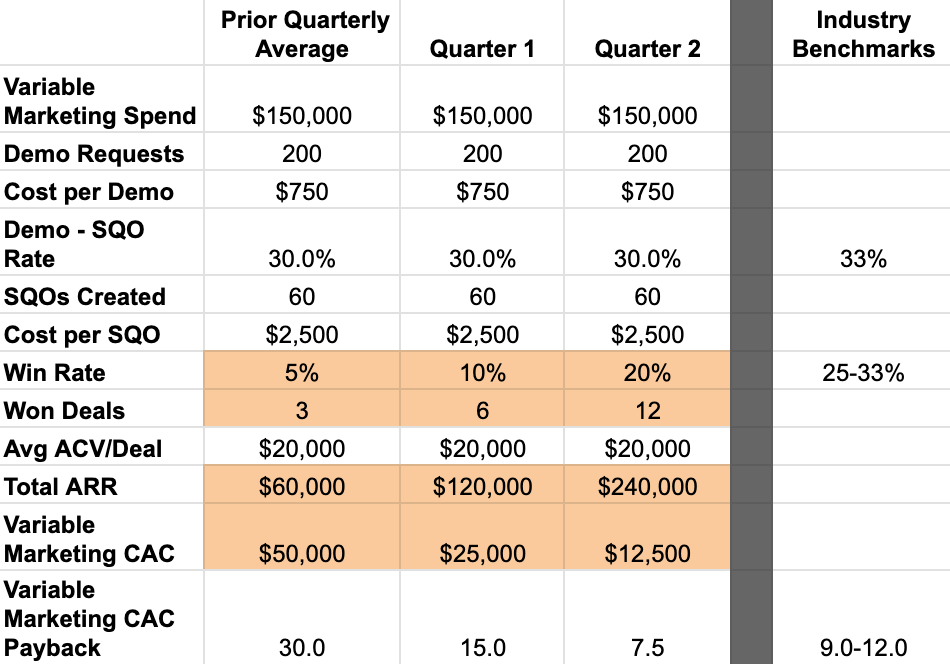
Your win rate will significantly increase as you’ve fixed the things that prevented prospects from buying
The number of closed won deals + corresponding booked revenue will take off up + to the right
Your CAC will drop off to a much more reasonable + scalable level
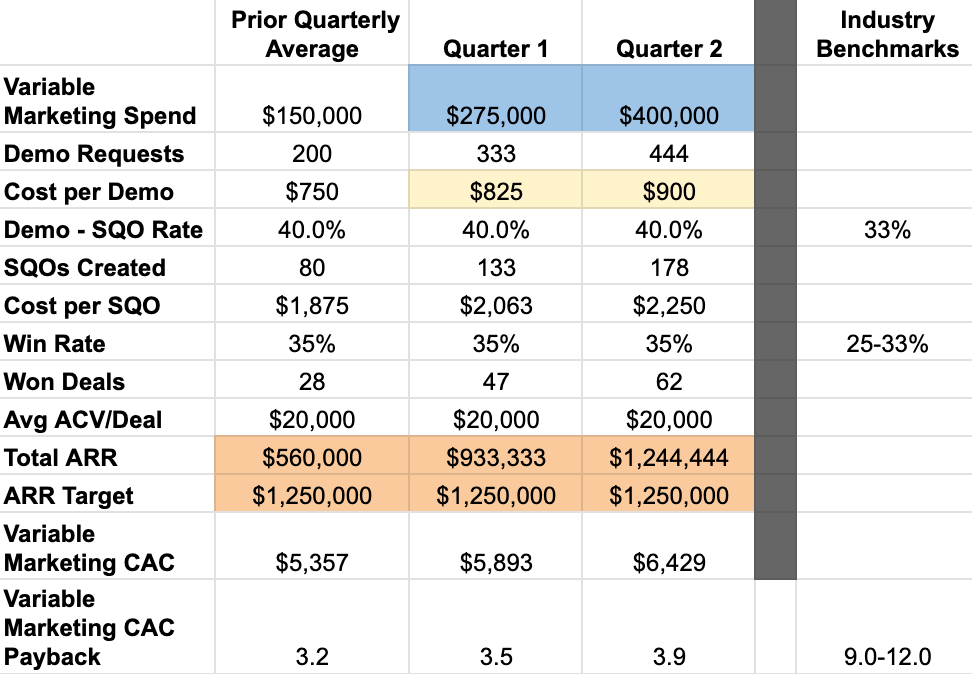
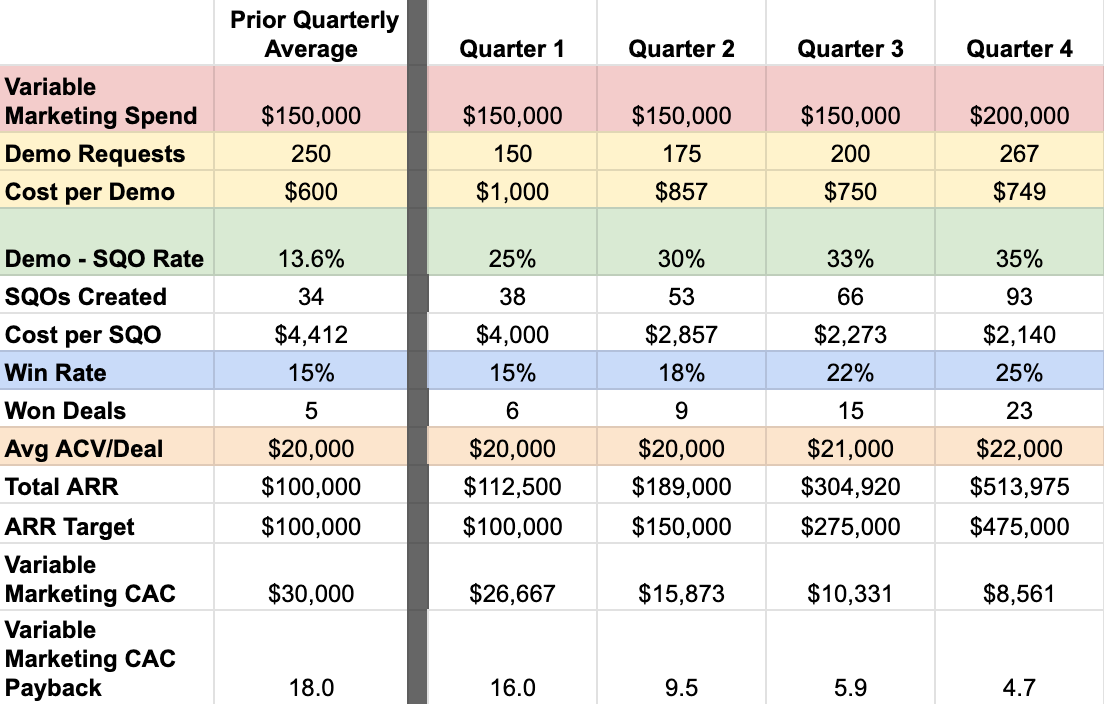
Funnel issue #4: unrealistic goals
And that leaves us with the best for last - unrealistic goals 🙃
Huge growth targets. A leadership team + board that are deadset on hitting it…
…and a slight disconnect from reality when you start looking at the numbers.
How to spot this:
Everything is measured + defined correctly (leads are actual leads, SQOs are actual qualified opportunities, etc.)
Conversion rates + CAC payback are well above benchmarks
The only funnel “problem” is that the revenue generated is falling short of the revenue “goal”
So in the example above, we see this in the orange cells as the ARR booked is less than the ARR target given to us. Everything else is very healthy.
How to fix this:
The only main lever we can pull is at the very top - the amount being spent across paid media + content production costs
Share where we can spend more before seeing diminishing returns
Paid search:
Impression share lost due to budget
Add additional high-intent keywords
Expand into Microsoft Ads
Paid social:
Reach is < 40%, penetration is < 80%, and/or frequency is < 10
Add additional campaigns/mediums (more educational content, videos, etc.)
Explore other platforms like Reddit, Twitter, Facebook, etc.
Expand organic social presence
Most importantly: Ask to better understand how the goals were calculated and what assumptions were made that led to the goal being set
What this looks like as it’s played out over a few quarters:
Your ARR will increase as you put more resources into play
BUT, this comes with the following “costs”:
You will have to spend more on variable marketing (ads, agencies, etc.)
Your cost per demo is probably going to increase (growth isn’t linear + there is a point of diminishing returns)
Your CAC + payback periods are going to increase
This last one is OK! Because you were so efficient before, you were actually leaving money on the table at the expense of growth
This doesn’t give you permission to go crazy on spending, but this is when you should be having a conversation with leadership about what’s being left on the table if high growth is the true expectation
Example: where you should start
You probably don’t fit perfectly into one of these “common” funnels. You might have some aspects of one funnel + some aspects of another. What you do know is that there’s room for improvement, but you just aren’t sure where to start.
Based on everything we’ve covered above, here’s an example funnel that’s probably closer to something you are or have experienced + how I would recommend going about optimizing it.
What jumps out to you in here?
Take a moment and think about this. I’m going to give you some scroll time so I don’t spoil the answer for you with what’s below
…
…
…
…
…
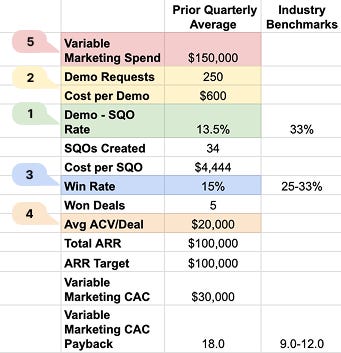
Here’s the order I would tackle it in
Demo → SQO rate (marketing/sales alignment)
We can insert common fixes quickly here (prospect schedule meeting, fix internal data syncing, kickoff better marketing/sales alignment)
Demo quality/volume (lead gen 101 or broad targeting)
This is often seen after 1-2 quarters of our programs running. We will absolutely influence this number, it just takes time to play out
Win rate (product/market fit mismatch)
A result of the above + the length of their sales cycle
Annual contract value
This one + #5 shouldn’t be done UNTIL the first 3 above have been addressed
This will be a function of better targeting, truly understanding your ICP and who values your product/service, AND then some fine-tuning of your plans/offers
Variable marketing spend
Don’t touch this until everything above is efficient + firing on all cylinders, otherwise you’re just burning cash
Which leads us to how this looks as it’s played out over the following year:
A thing of beauty.
Don’t get caught up in the dip in demo requests, you’re generating more SQOs now than you did before with that first emphasis on increasing demo → SQO rate.
Everything else cascades as a result of what we covered above if you take things through those 5 steps. Then you get to sit back, give yourself a pat on the back, and can finally take a breath in knowing you aren’t playing constant catch up to your goals.
Now what?
You’ve got the framework + you’ve got the spreadsheet to toss your data into. Now the question comes down to understanding what’s going on in your funnel.
Grab the spreadsheet + fill in the input (green) cells. You’ll quickly get a sense for what is/isn’t working + will either validate something you may have been feeling already or may be the unlock you needed to get to the next stage of growth.
I’ve gone through this exercise with well over 100 companies + I love it because it flat out works. It’s simple + points out what’s going on.
Some can run with it solo from here to see where they stand + act on it from there. Others need help translating the diagnosis and/or acting on it. Either way, you now know how to approach this exercise + that’s half the battle.
If you need help or want to walk through yours together, simply hit reply. Replies to this come directly to my personal email + I’m happy to help figure out next steps.
And because this was a long email, here’s a link to that sheet again just in case 🙂
Book quote of the week
Since I brought up John Boyd earlier, it was only fitting to have something from his biography this week:
“We were each given a mystery solution containing half a dozen or so compounds. Each solution was different. Our task was to identify the compounds. The grade depended on how many you could identify. Mine was a clear solution with absolutely no clue to its ingredients. We had four weeks to decode it.
There were two different ways of going about the analytical process. One was by following preordained steps, rigorously identifying some compounds and eliminating others step by step by step. If you did everything correctly and interpreted your results correctly, this was bound to lead to the correct result - eventually. However, this rigorous process was extremely cumbersome and time-consuming, and there was a danger of running out of time.
Alternatively, you could make your own path. You could start with the rigorously mandated, conventional process, but as the results unfolded, you could take an intuitive leap and make up your own sequence of experiments, adjusting them as more results became available. This method had the advantage of being much more direct and faster, but it was more risky because if your experimental flow went in the wrong direction, you could blow the whole assignment.
I was confident enough in my grasp of inorganic chemistry to choose the high-risk option. After a few steps, I departed from the predetermined flow and, keeping careful notes, struck out in a direction that seemed logical to me.”
- Swimming Across, by Andrew Grove
See you next Saturday,
Sam
This is a great read, thank you Sam!
Now to use this as some additional source material for my funnel audit skill in Claude (as long as I have your permission and blessing 😅)
Dude…this is one of the most elegant distillations of B2B marketing knowledge I’ve ever seen. Should be a masterclass.
An interesting follow up would be how brand marketing spend fits into the picture and how you account for it internally. (addressing the point about only so many channels and diminishing returns over time).