

The best medium to drive brand awareness
Hint: it's been used for decades, but measured wrong in recent years

For years, I remember reviewing all of the various creative assets that we’d be pushing out to the market, and like clockwork, I would always see the same thing:
Single-image ads driving to landing pages having the highest clickthrough rates (CTR) and lowest cost per click (CPC)
Video ads having the lowest clickthrough rates (CTR) and highest cost-per-click (CPC)
The data would then go to my manager, my manager’s manager, and sometimes even up to the CEO. And I could bet my yearly salary on the response that would come back from them:
“Video isn’t working for us, let’s stop spending money on those.”
It wasn’t until a few years ago that I realized there was one GIANT flaw in how I was analyzing these previously.
Single-image ads are designed to pique curiosity and require that a user click on it so they can get to the content it’s about. So do you remember those two metrics we were talking about above? CLICKthrough rate and cost-per-CLICK? It’s no wonder these do better with those metrics because that action needs to occur to get to the meat of what’s being advertised.
Meanwhile, video ads play in-feed for the target audience. All a prospect has to do is scroll through the feed as they normally would, and if they want to see the ad, all they have to do is stop scrolling so they can watch the video. No clicking required.
How the content is being delivered is entirely different because it’s in two different mediums, so of course using the metric that’s designed for single-image ads for video isn’t going to work.
Enter: a metric calculating for content consumption to normalize across various mediums…
Cost per percentage of content consumed

Yes, it’s a mouthful
Yes, it’s wildly nerdy
Yes, it’s going to completely change how you determine what works
The beauty of it is that it works across all of the mediums we use to get to an apples-to-apples comparison.
Single-image ads
Video ads
Carousel/document ads
And here’s how I do it:
📷 Calculating for single-image ad consumption
This is where you'll need to go beyond the ad platform and add custom scripts to your website so you can track scroll depth.
(For instructions on how to do this, here is a link to a Google Help article to do this with Google Analytics by using Google Tag Manager)
I typically add a few in so you can see 25%, 50%, and 95% scroll depth (I don’t do 100% because nearly no one reads through the bottom of the footer and that’s not really a part of the content being served).
Then take the total spend on the campaign using the single-image medium and divide that by your desired increment listed above to get to the landing page cost per X% of content consumed.
Pro tip: I would recommend having multiple of these made as well. I try to match the same percentages used from video and carousel/document so I can have an apples-to-apples comparison of them.
🎥 Calculating for video ad consumption
Ad platforms have video metrics natively that allow you to see how many users watch certain percentages of videos. These are often in increments like 25%, 50%, 100%, etc., or are certain lengths of time the video was watched like 3 seconds, 10 seconds, etc.
In order to calculate this metric, what you do is you take the total spend of the campaign using the video medium and divide that by your desired increment listed above to get to the video cost per X% of content consumed.
Pro tip: I would recommend having multiple of these made. I typically set up cost per 25% of content consumed, cost per 50% of content consumed, and cost per 100% of content consumed.
📄 Calculating for carousel/document ad consumption
Similar to video, ad platforms have document metrics natively that allow you to see how many users get to certain percentages of the carousel/document. These are in increments of 25%, 50%, 75%, and 100%.
In order to calculate this metric, what you do is you take the total spend of the campaign using the carousel/document medium and divide that by your desired increment listed above to get to the carousel/document cost per X% of content consumed.
Pro tip: like the above, I would recommend having multiple of these made. I typically set up cost per 25% of content consumed, cost per 50% of content consumed, and cost per 100% of content consumed.
Let’s think about why this works
→ Social media platforms don’t want users to leave the platform. The longer they stay on the platform, the more ads they can serve which makes them more money.
→ It’s less intrusive to the user to stop their scroll and watch something while in the feed than to click on something, and then go and read through it in another place
→ You can communicate (and comprehend) more and faster via video than you can written word
All of this to say, once you understand how users consume your content and how you can measure it appropriately, you will open your eyes to an entirely different dataset and way to analyze what content AND medium actually lands best with your market.
Remember: the goal is for the content to be CONSUMED by the end user.
Let’s use a quick example to help illustrate this. Say you’re running across two mediums, video + single-image, and you see the following initially:
Campaign 1 (Video campaign):
→ 0.67% CTR
→ $1.88 CPC
Campaign 2 (Single-image ad campaign):
→ 3.50% CTR
→ $0.33 CPC
If we measured + analyzed like we used to, it would appear that the single-image ads worked significantly better.
So now we layer in the content consumption data + see the following:
Campaign 1 (Video campaign):
→ 0.67% CTR, $1.88 CPC
→ $0.31 cost per 50% video consumed
→ $0.82 cost per 95% video consumed
Campaign 2 (Single-image ad campaign):
→ 3.50% CTR, $0.33 CPC
→ $1.46 cost per 50% landing page scrolled (consumed)
→ $3.79 cost per 95% landing page scrolled (consumed)
With this new data, we actually see the opposite of the initial finding and uncover that video was better than single-image. But this won’t always be the case. That’s why it’s important to be able to compare them in an apples-to-apples manner.
If you’re interested in testing this for yourself, I would recommend doing it so everything is as identical as possible, with the only difference being the medium.
Customer stories are very easy to do this with, so I would start here.
Pull a customer story you have that you know has landed well overall with your market before.
For the single-image ad campaign, you have the landing page already (the written customer story). What you will want to do is create a single-image ad that speaks to something like the results they saw, a quote from the story, etc.
For the video ad campaign, you will want to create a video ad using the content from the written version. You can either do this via “talking head” where you or the featured customer talks about the same things that were covered in the written version. This could include things like the problem they had, the solution they found, the results they saw, etc.
Now you set up two campaigns in the ad platform, apply the same variables (give them the same daily budget, target the same audience, set the placements as the same so they only show in-feed, etc.), and let the campaigns run until you have enough data to find statistical significance between the two.
Congrats, you have successfully graduated from 101-level campaign measurement into 301.
You may need to pick your CMO’s jaw up off the floor after you run through this analysis with them showing them which medium most efficiently gets your message across to your market.
One book passage I highlighted this week
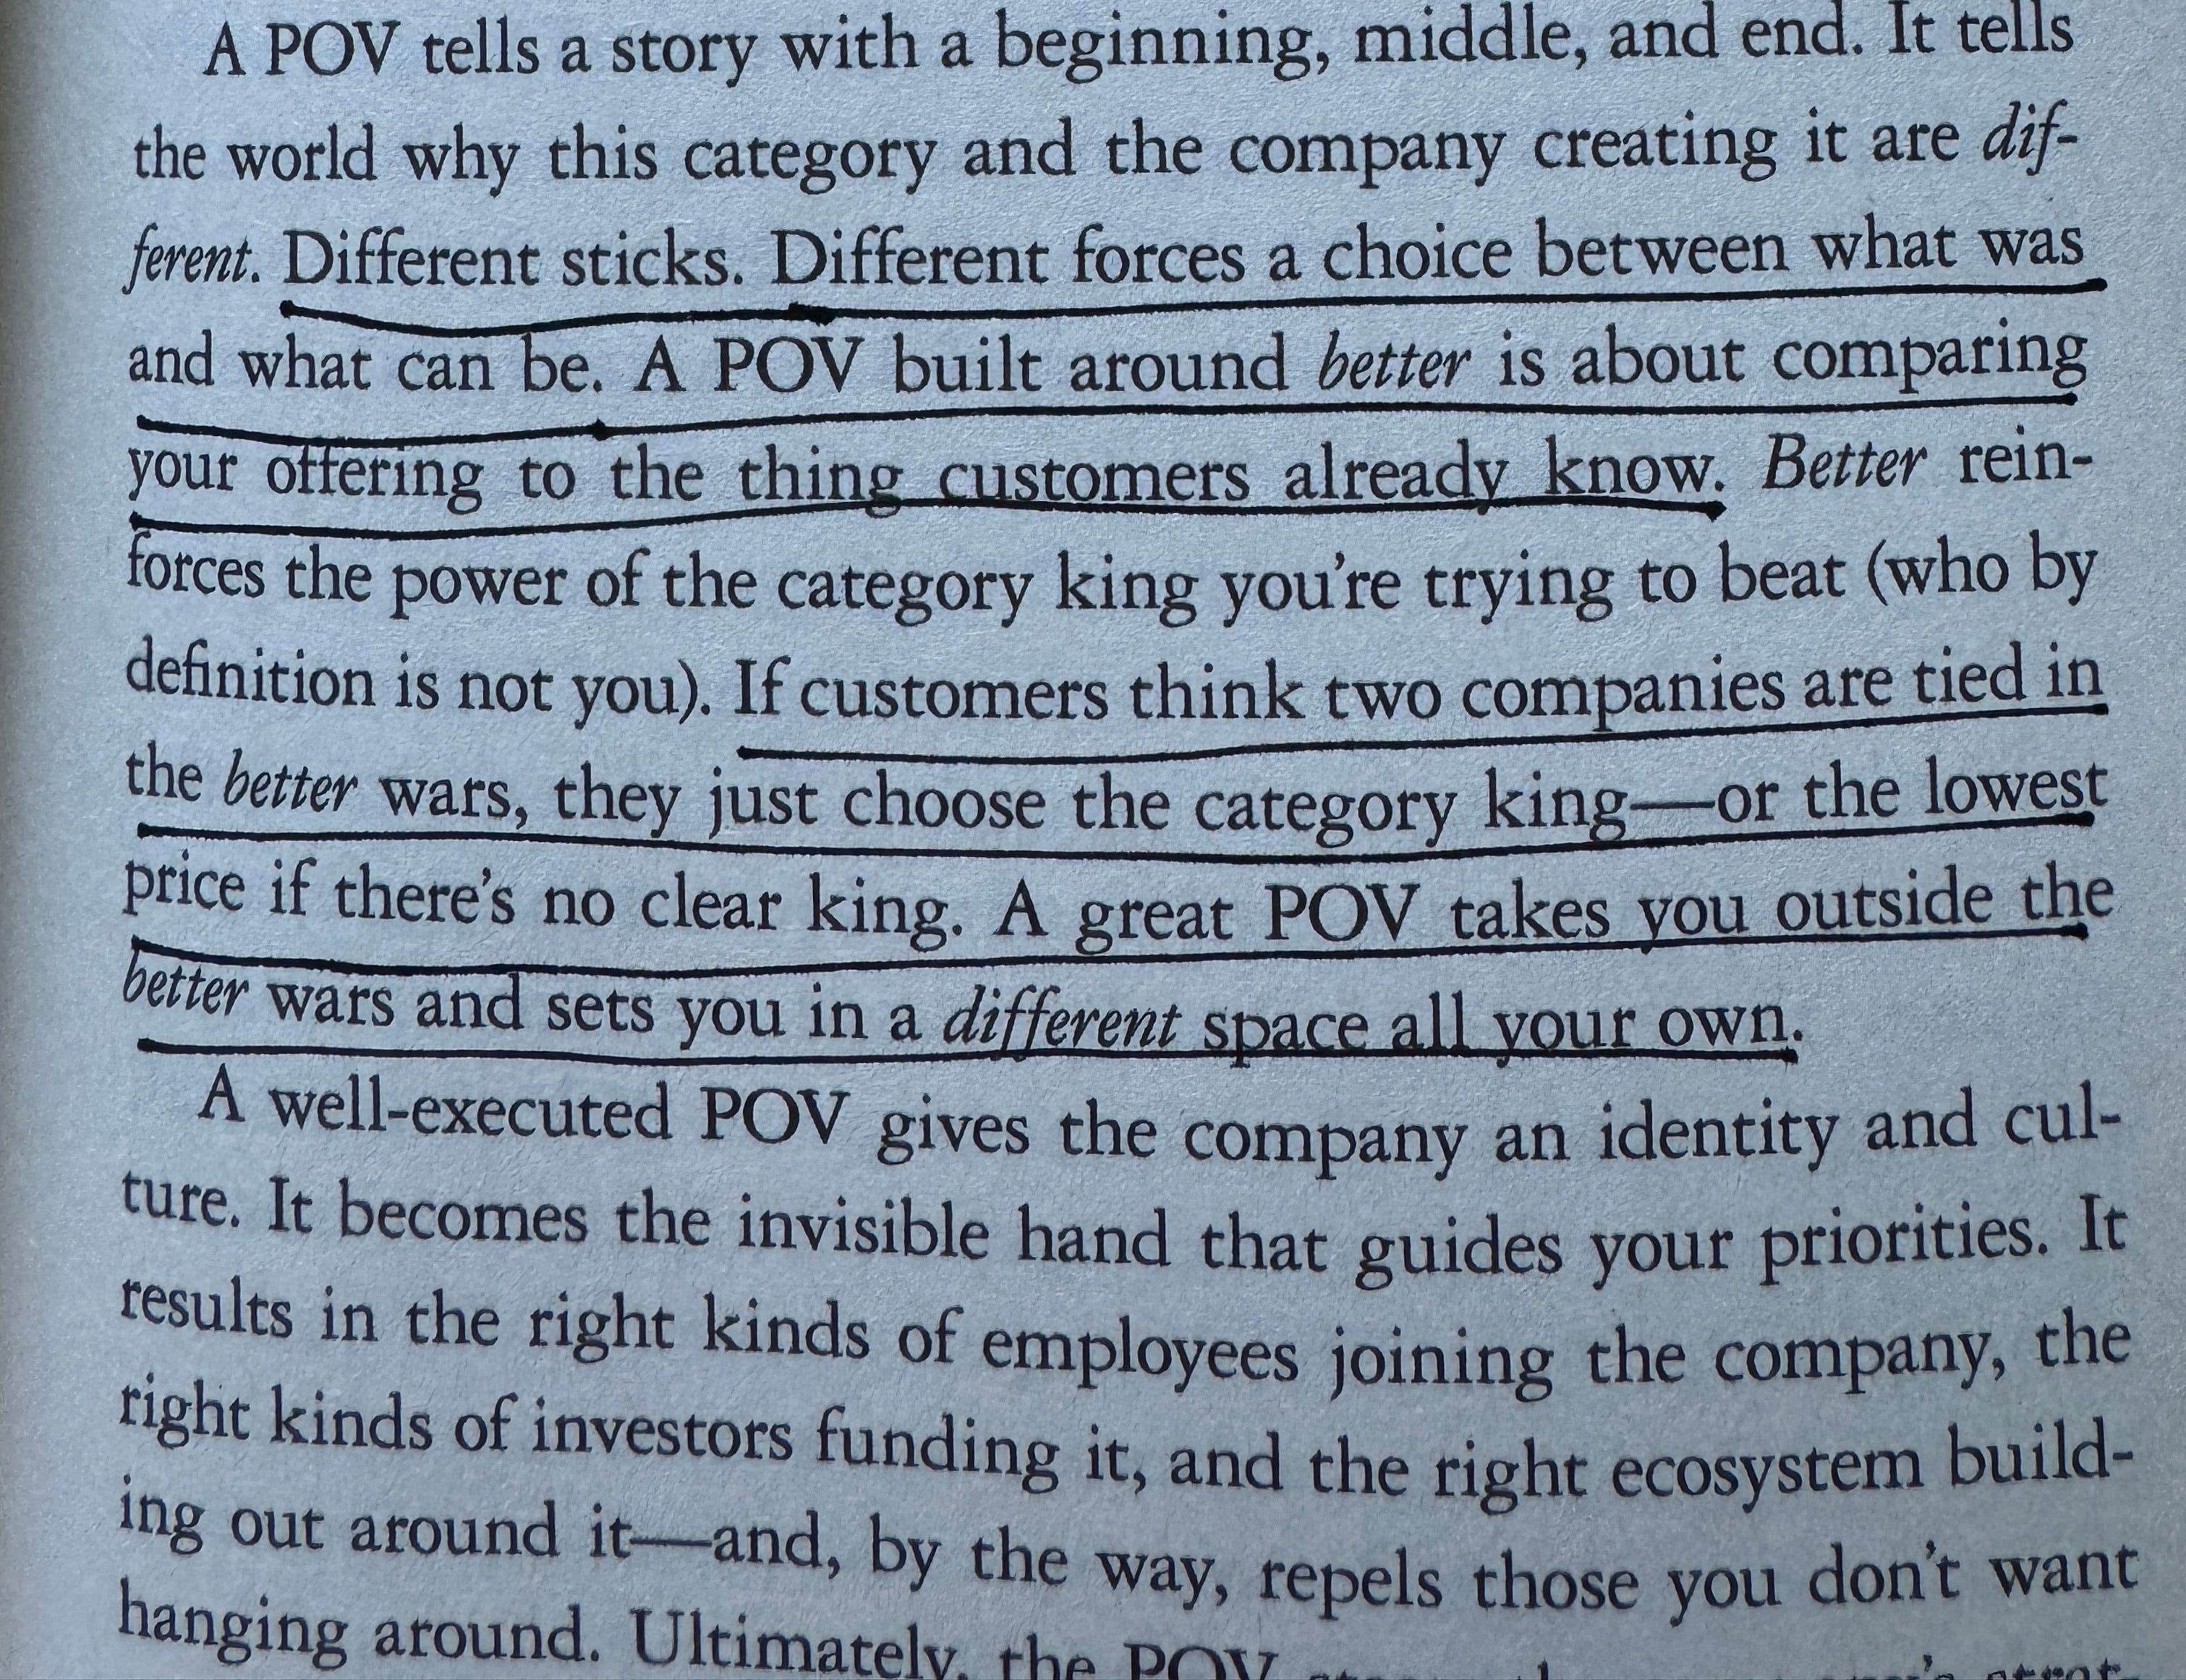
Changing it up slightly this week + calling out a passage I read this past week instead of a LinkedIn post.
This comes from Play Bigger: How Pirates, Dreamers, and Innovators Create and Dominate Markets as I’ve been really diving into category creation + messaging lately. My biggest takeaway from this is how well they are able to show the impact of why you should aim to be different, not better. The above passage speaks for itself, so I don’t need to add anything further here. Book was a good read overall - one of only a few business books I actually read in its entirety.
See you next Saturday,
Sam
This approach is very sensible. BTW, I’ve noticed that scroll depth is a shockingly under-utilized web KPI, especially given our propensity for mile-long pages in SaaS